AI Observatory

Land. Power. Compute.

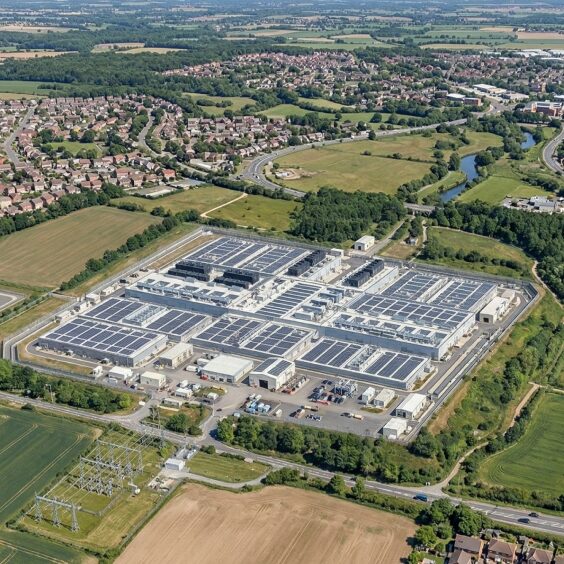
CUDO Observatory connects the critical factors that determine where and how AI infrastructure can be deployed, giving decision-makers a clearer view of the trade-offs, dependencies and constraints behind their infrastructure strategy.

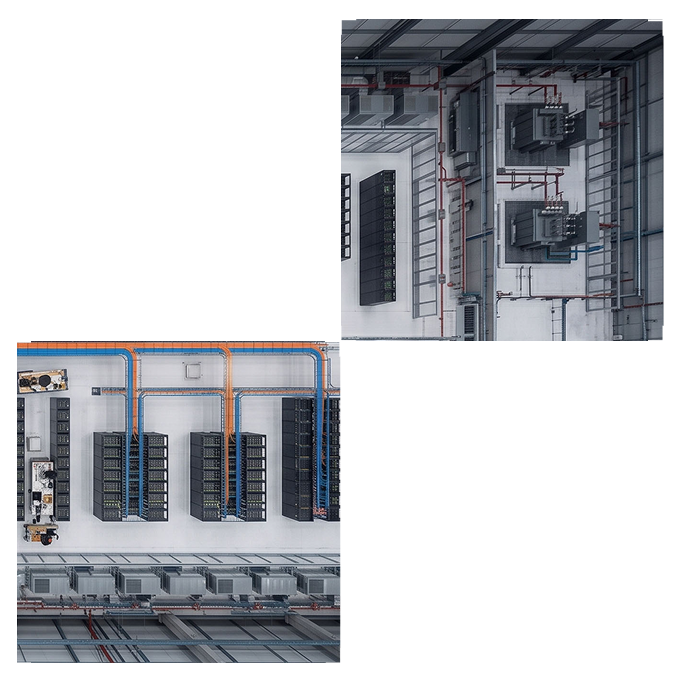
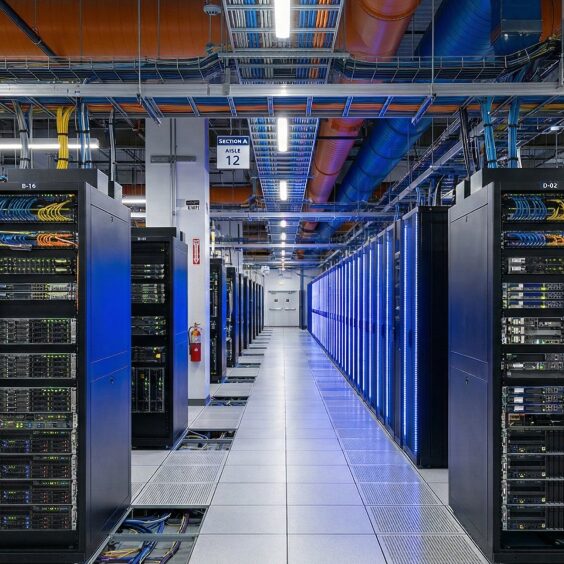
A data centre plant room of chilled-water and fire-main pipework, cornered against an overhead view of a data hall with blue and orange cable containment
Critical Numbers

The signal at a glance

Numbers that define the AI infrastructure landscape entering the 2028–2029 supply crunch. Each resolves to one canonical claim — open its evidence receipt for source, period and rights.

Data as of 15 July 2026

~$1.15tn

Hyperscaler capex, 2025–27

Goldman Sachs estimate · more than double the prior three years

2,060+

US interconnection queue (GW)

Proposed generation & storage seeking connection — not delivered power

~945

Global data-centre demand by 2030 (TWh)

IEA projection · 415 TWh in 2024

19 + 13

EU AI Factories + Antennas

Operational under the EuroHPC programme

~$90bn (2026)

AI infrastructure market, 2026

Analyst forecast · toward ~$465bn by 2033

<5%

Europe's share of AI compute

US hyperscalers hold ~70% of the European cloud market

Three corridors · side by side

The same dimensions, the same sources

Every blank is a stated reason, not an omission. The striped cells are where a source exists but we cannot reach it — or where the thing itself does not exist.

What changed

Since the last report

Manually reviewed developments across power, policy, capacity, supply and pricing since v0.7. Each card cites its source; only reviewer-approved entries appear.

Policy and regulationVerifiedEuropean Union2026-Q1

EU AI Act application dates confirmed as staged through 2028

Latest update

Regulation (EU) 2026/1744 preserves the AI Act general application date of 2 August 2026, with Annex III high-risk obligations from 2 December 2027 and Annex I high-risk obligations from 2 August 2028.

Why it matters

Regulated workloads must plan against staged obligation dates, not a single 2026 high-risk enforcement date.

Published 2026-Q1Verified 28 July 2026
Hardware and supplyVerifiedGlobal2026-Q1

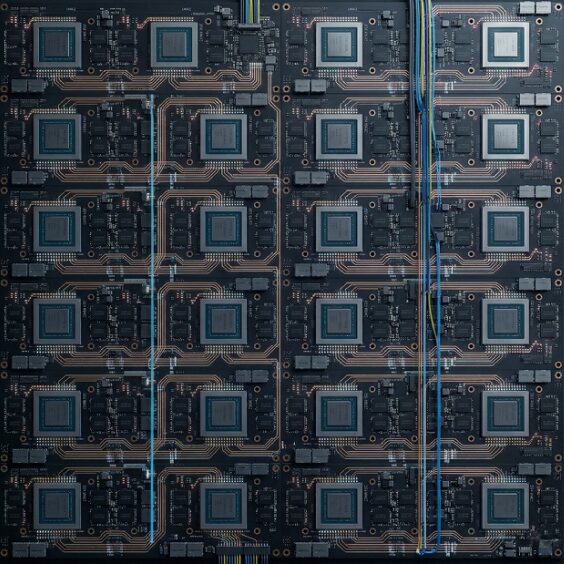
NVIDIA sets 800 VDC full-scale production to the 2027 Kyber generation

Latest update

NVIDIA states that full-scale production of 800 VDC data centres will coincide with the Kyber rack generation in 2027, not the 2026 Vera Rubin platform.

Why it matters

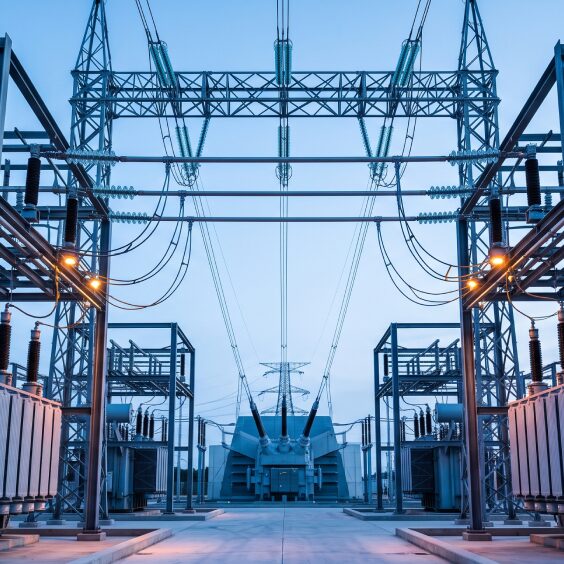
Facility electrical design timelines shift: 800 VDC is a 2027 Kyber-era assumption, correcting the earlier 2026 expectation.

SourceNVIDIA
Published 2026-Q1Verified 28 July 2026
Hardware and supplyVerifiedGlobal2026-Q1

Vera Rubin NVL72 named as NVIDIA's next rack-scale platform

Latest update

NVIDIA's GB300 raises HBM3e to 288 GB per GPU with the NVL72 rack cited at around 1.5x GB200, and the next rack-scale platform is confirmed as the Vera Rubin NVL72.

Why it matters

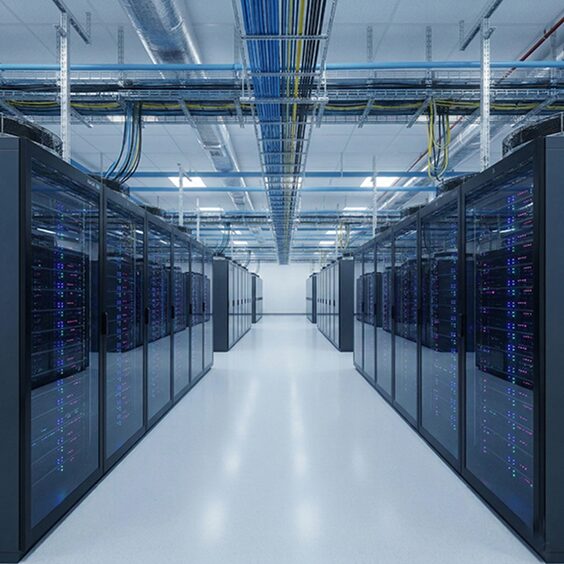
Cluster planners should design against Vera Rubin NVL72, replacing stale NVL144 and exaFLOPS figures.

SourceNVIDIA
Published 2026-Q1Verified 28 July 2026
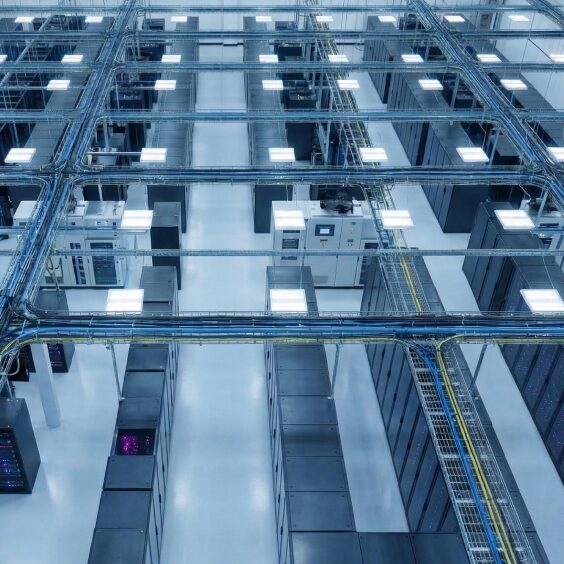
Grid and powerVerifiedGlobal2026-Q1

IEA projects global data-centre electricity toward ~945 TWh by 2030

Latest update

The IEA projects global data-centre electricity consumption rising from about 415 TWh in 2024 toward roughly 945 TWh by 2030, replacing the earlier '1,000 TWh by 2026' framing.

Why it matters

The corrected trajectory sets a realistic horizon for AI-driven electricity demand and grid planning.

SourceIEA
Published 2026-Q1Verified 28 July 2026
Pricing and economicsVerifiedGlobal2026-Q1

Token prices fall ~99.7% while total AI bills rise

Latest update

Unit token prices have fallen roughly 99.7% since the GPT-3 era, yet total enterprise AI bills have risen as agentic workloads multiply token consumption per task.

Why it matters

Falling unit prices do not reduce total inference spend; volume growth dominates the economics.

Published 2026-Q1Verified 28 July 2026
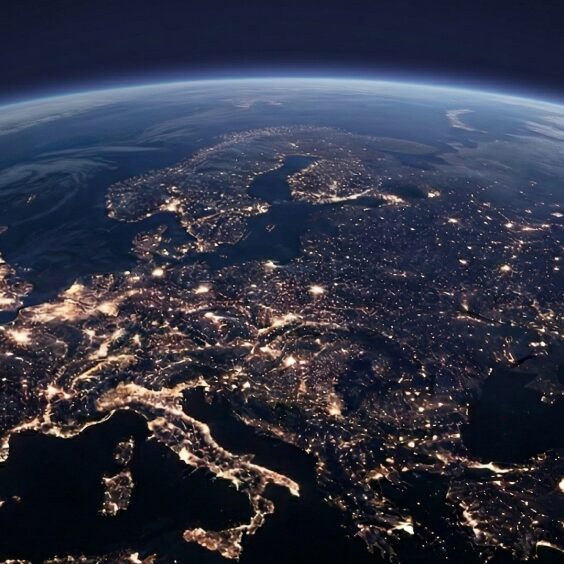
Pricing and economicsVerifiedGlobal2026-Q1

Neocloud GPU pricing undercuts hyperscaler defaults

Latest update

Specialised neocloud providers rent comparable GPUs materially below hyperscaler list pricing, with reported buyer savings in the 40–70% range.

Why it matters

Placement and provider choice, not just GPU model, drive a large share of cluster cost.

SourceCoreWeave
Published 2026-Q1Verified 28 July 2026
“The window to lock favorable, power-anchored AI infrastructure economics is closing. Whoever secures firm power, sovereign-compliant capacity, and reserved compute at 2026 pricing — while modeling depreciation and goodput honestly — will hold a durable cost and capability advantage through the 2028–2029 supply crunch.”

Executive summary · Bottom line

Navigate

The watches

Each watch tracks one structural force shaping the AI factory. Dive into interactive data, charts and analysis.

Top 10

Key findings

The decisive shifts across power, build, silicon, sovereignty and economics.

Over 2,060 GW sit in U.S. interconnection queues. Median time-to-power has doubled to 4–5+ years. Treat secured power — not announced megawatts — as the gating asset.

Methodology

Evidence base

Survey coverage, interview depth and collection period behind this release.

n=701

Survey respondents

15

In-depth interviews

3

Regions · UK, US, Europe

February 12–25, 2026

Data collection · Censuswide

Turn these signals into a placement decision

Discuss power, location, cluster architecture and TCO with a CUDO AI infrastructure specialist.